By Jason Teed
The major U.S. stock market indexes were up last week. The Russell 2000 small-capitalization index rose 3.89%, the S&P 500 was up 3.48%, the NASDAQ Composite gained 3.37%, and the Dow Jones Industrial Average increased by 3.22%.
All 11 market sectors rose for the week. Energy and Consumer Discretionary were the top-performing sectors, gaining 6.17% and 5.58%, respectively. Health Care and Communication services were the worst-performing sectors, gaining just 1.76% and 1.46%, respectively.
Stocks
Stocks were up significantly last week, and it appears that bond rates are either holding steady or declining.
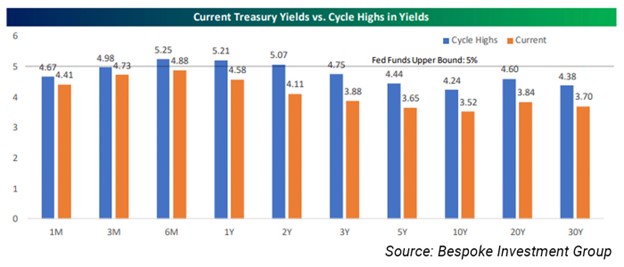
With the recent turmoil in the banking industry, the market is anticipating that the cycle of bond-rate increases is nearing its end. Treasury bonds of all maturities are off their cycle highs. This expectation has brought more certainty to the equity markets.
This is partially due to anticipated changes in the banking sector. Bank behavior will likely affect credit growth beyond what the Federal Reserve is doing by increasing rates. Going forward, banks will probably employ more restrictive lending policies, further tightening credit and creating more drag on inflationary pressures.
And inflation readings themselves appear to be declining. On Friday (March 31), a report indicated that monthly inflation from January to February rose only 0.3%, half the previous month’s increase. European markets are beginning to see similar trends as well.
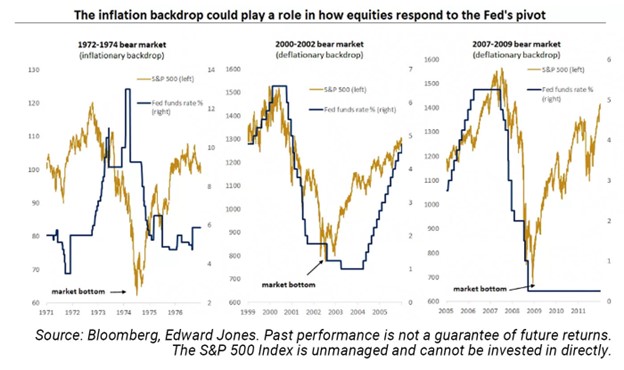
With the rate cycle nearing its end, the market is left to anticipate the end of the current bear market. In more traditional bear markets, the equity market doesn’t typically bottom out until rates have. These types of markets usually face deflationary pressures. However, in the 1970s, when bear markets were caused by rising rates employed to curb inflation, the bear market ended just after the top of the rate increase cycle.
The bear market may be nearing its end, but we could experience further volatility in the coming months. The next earnings season in April could have a significant impact on the equity market. It remains to be seen how deeply increased rates will affect the economy and corporate profitability. If we’re nearing the end of the tightening cycle, the April earnings season could be pivotal. We could see how much market participants are determining the depth of the current bear market.
Recent equity market movements and slowing rate increases reflect optimism. The total effect of the higher interest-rate environment in equities remains to be seen. Many indicators are still showing that a recession is likely.
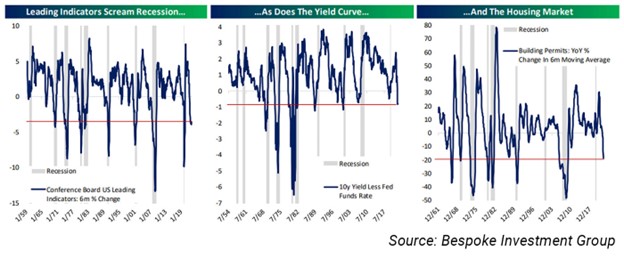
For example, leading indicators published by The Conference Board (which attempts to quantify market cycles) indicate weakness going forward, as does the inverted yield curve.
Typically, bear markets occur during or after a yield-curve inversion. However, the current market cycle is different from the deflationary ones of the past, so take these indicators with a grain of salt. The economy still has many underlying positive attributes. Jobs remain resilient and have exceeded market expectations despite these threats. While increasingly unlikely, the Fed may still be able to engineer a “soft landing” (slowing inflation without triggering a recession) for the economy.
Despite the positive movements we’ve seen in recent weeks, more market volatility is anticipated. A cautious and active approach to the market will likely be more advantageous than assuming the worst is over.
Bonds
Treasury yields mostly rose for the week. One-month and one-year maturities rose the most. These movements caused the yield-curve inversion to steepen. Additionally, the two-year rate remains below the current fed funds rate. Typically, this happens just before the Federal Reserve stops increasing rates.
Both term and credit yields contracted last week, giving conflicting signals about bond-market expectations of the economy. Overall, long-term Treasuries underperformed high-yield bonds, and long-term and short-term government bonds performed roughly the same.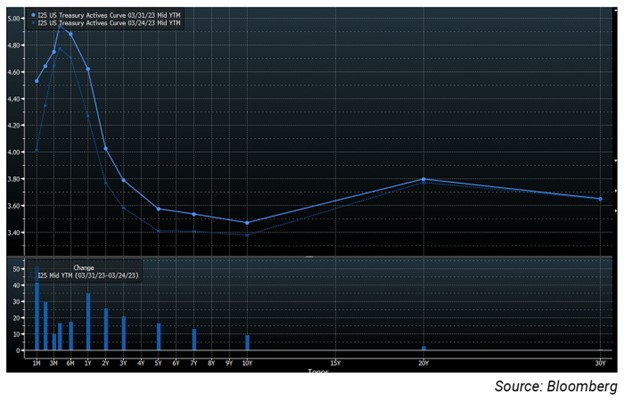
Gold
Spot gold fell 0.45%, experiencing headwinds from continued rising rates.
The metal had recently been enjoying some tailwinds: Inflationary pressures seemed to have subsided a bit, and economic indicators suggested that the economy was slowing. However, it appears the Federal Reserve has not let that deter it from increasing interest rates further. OPEC’s recent cuts to oil production have put inflationary pressure on the global economy, giving the Fed less wiggle room to reduce rate increases should a recession begin to materialize.
Non-currency safe-haven assets, such as long-term Treasurys, were also down for the week, as longer-term rates rose for the period. The higher-than-normal correlation between gold and stocks that occurred in much of 2022 appears to be decreasing.
Flexible Plan Investments (FPI) is the subadvisor to the only U.S. gold mutual fund, The Gold Bullion Strategy Fund (QGLDX), designed at its introduction nine years ago to track the daily price changes in the precious metal.
The Indicators
Our Political Seasonality Index began last week out of the market, entering on Tuesday’s (March 28) close. (Our QFC Political Seasonality Index is available post-login in our Weekly Performance Report section under the Domestic Tactical Equity category.) The very short-term-oriented QFC S&P Pattern Recognition strategy’s equity exposure changed frequently last week. It started 0.5X short, changing to 1.1X short on Monday, 0.2X short on Wednesday, 0.6X short on Thursday, and 1.2X short on Friday. The strategy has been much more active lately than in the earlier parts of 2022.
Our intermediate-term tactical strategies are mixed in exposure. The Volatility Adjusted NASDAQ (VAN) strategy began last week neutral, changing to 20% long on Monday’s close and 40% long on Friday’s close. The Systematic Advantage (SA) strategy was very active last week, changing from 30% to 60% to 90% and back to 60% over the week. Our QFC Self-adjusting Trend Following (QSTF) strategy began the week neutral to the market, changing to 1X long for the week. VAN, SA, and QSTF can all employ leverage—hence the investment positions may at times be more than 100%.
Our Classic strategy was out of the market for the week. The strategy can trade as frequently as weekly.
Flexible Plan’s Growth and Inflation measure, one of our Market Regime Indicators, currently indicates a Normal economic environment stage (meaning a positive monthly change in the inflation rate and positive quarterly GDP reading). Historically, a Normal environment has occurred 60% of the time since 2003 and has been a positive regime state for equities, gold, and bonds. Gold tends to outpace both stocks and bonds on an annualized return basis in a Normal environment, albeit with higher risk.
Our S&P volatility regime is registering a High and Rising reading, which favors equities over gold and then bonds from an annualized return standpoint. The combination has occurred 23% of the time since 2000. It is a stage of relatively low returns and higher volatility for the three major asset classes.